Traffic Sign Detection
Summer School on Image Processing 2021
Emir Jusić, Ian Golob, Luka Paladin, Om Prakash Dash
Emir Jusić, Ian Golob, Luka Paladin, Om Prakash Dash
.PNG)
.PNG)
Recognition of traffic signs is a challenging real-world problem of high industrial relevance. Although commercial systems have reached the market and several studies on this topic have been published, systematic unbiased comparisons of different approaches are missing and comprehensive benchmark datasets are not freely available.
Traffic sign recognition is a multi-class classification problem with unbalanced class frequencies. Traffic signs can provide a wide range of variations between classes in terms of color, shape, and the presence of pictograms or text. However, there exist subsets of classes (e. g., speed limit signs) that are very similar to each other.
The classier has to cope with large variations in visual appearances due to illumination changes, partial occlusions, rotations, weather conditions, etc.
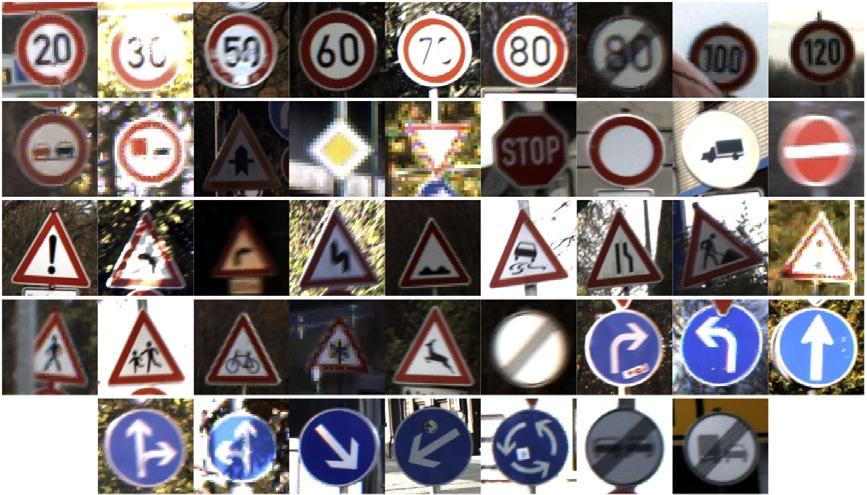
The traffic sign dataset is provided by German traffic sign benchmark and consists of 43 classes representing 43 different types of traffic signs shown in the image below. These don't represent all the types of signs that exist on the road but just a selection of types most commonly seen.
The images in the dataset are not evenly distributed between classes, and some classes consist of only 200 images whereas others consist of over 2000 images. Along with the images the dataset has annotated labels with bounding box data.
You can find the dataset here.
The problems with the dataset are that image sizes vary between images and the images are not necessarily squared. Also, the dataset does not contain any images of negatives (images without traffic signs) so it is necessary to generate those negative samples to better train the model.
To generate the negative samples we used random street images without traffic signs and then divided them into 64x64 samples. The images were then duplicated and darkened. Using this method ~40 000 negative samples were generated from ~100 street images.
After expanding the dataset the total number of samples was ~80 000.
The final step was converting the data to match YOLO’s input.
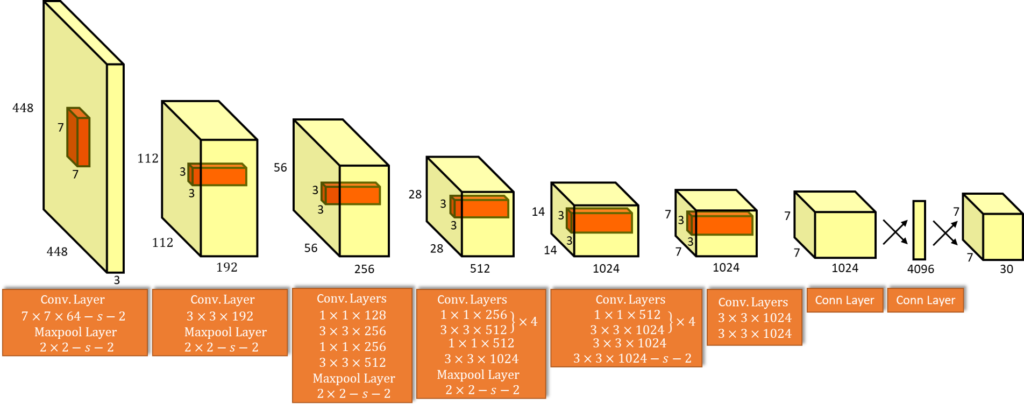
YOLOv5 is a family of object detection architectures and models pretrained on the COCO dataset, and represents open-source research into future vision AI methods, incorporating lessons learned and best practices evolved over thousands of hours of research and development.
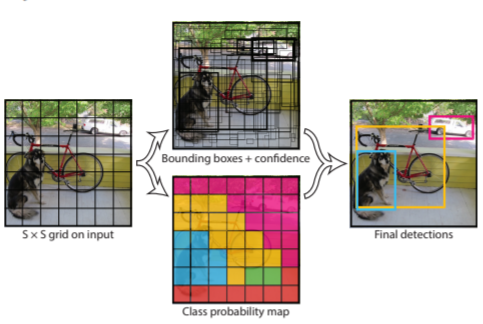
YOLO an acronym for 'You only look once', is an object detection algorithm that divides images into a grid system. Each cell in the grid is responsible for detecting objects within itself.
YOLO is one of the most famous object detection algorithms due to its speed and accuracy.
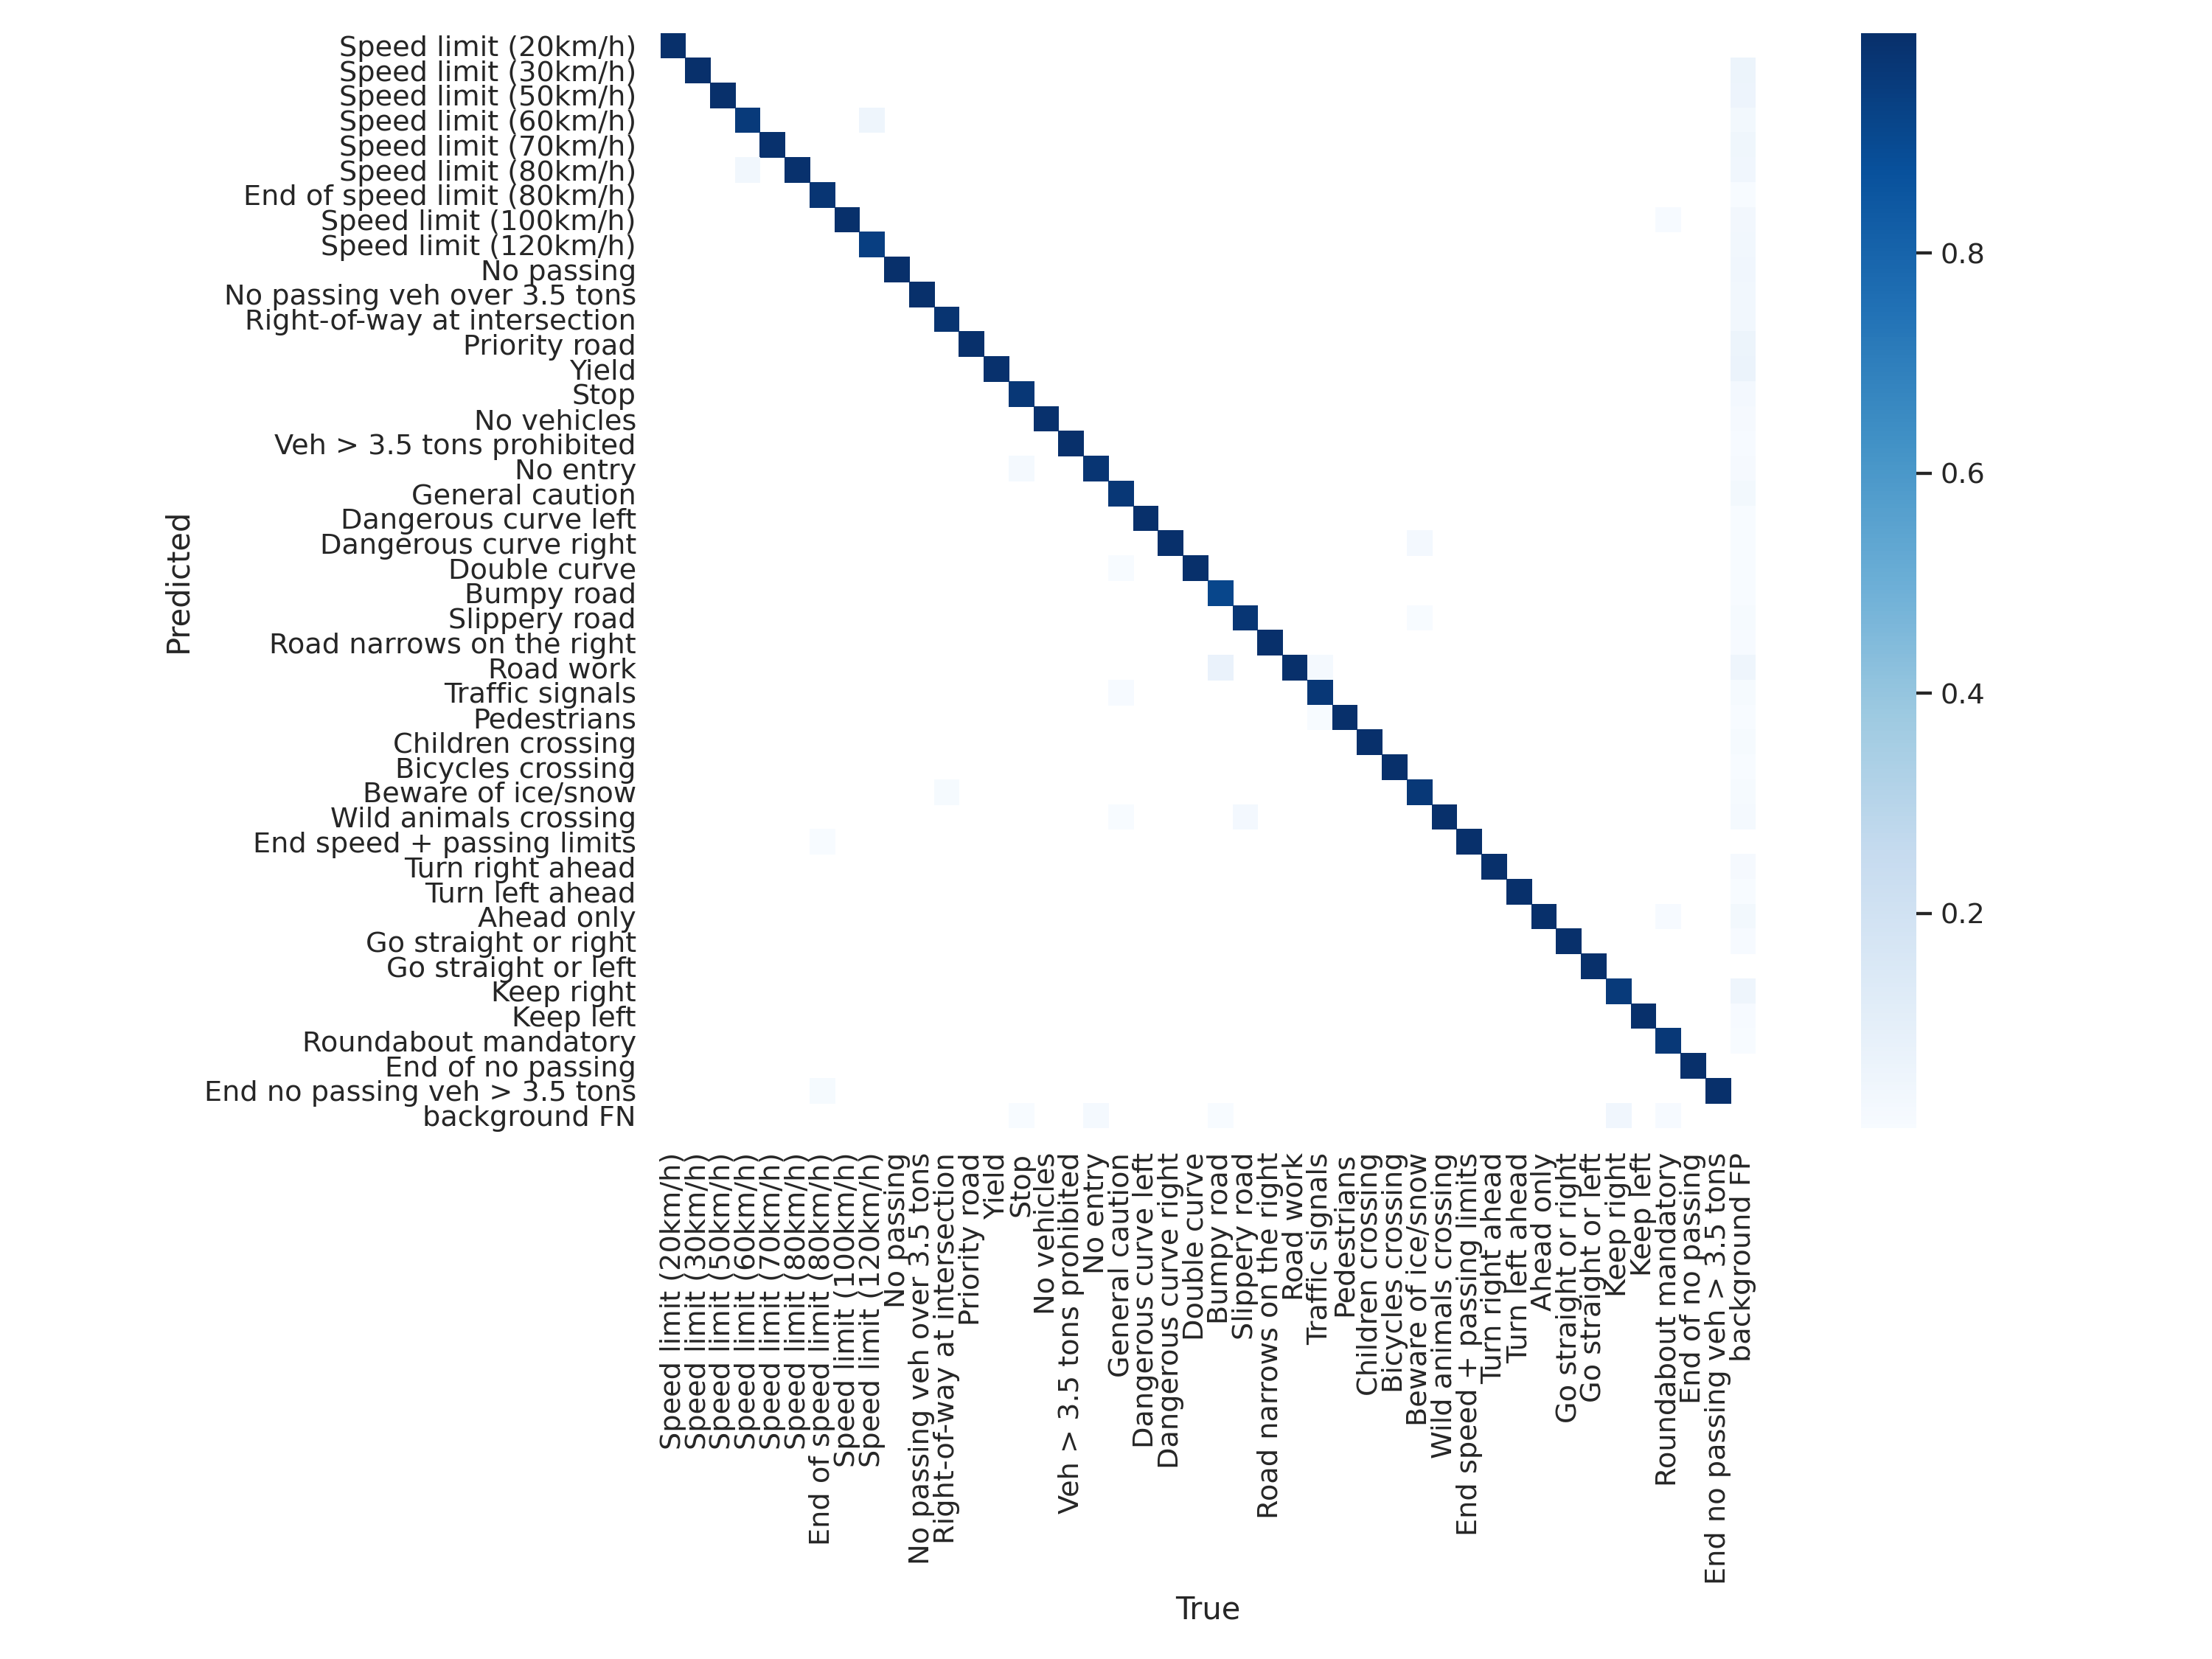
To benchmark the trained model the full GTSRB testing dataset was used.
The testing results were:
The code for the project was written using Google Colab. (GitHub link)